rpubs.com/rain8/1100036 Its a work in progress with only two steps finished. Not exactly an addon because its in R not Py. So far the project does many little things like find bugs in user’s collection, describe the growth of their collection and text mining. Ultimate goal is to hopefully be able to use anki as continuous cognitive test and allow users to learn about and optimize their memorization process. Instructions to run on your own data : github
It would be really nice to get feedback and user’s examples!
Screen capture of piece of the ‘similar word network graph’ since its not available in notebooks but is generated by the second step. Nodes are decks. Color denotes the final subject decks ended up in. Edges connect two decks that have lots of words in common.

Plot of the history of a single card. Shape is which difficulty was selected at this review. Size is how long thinking took. Color is log time delayed divided by due. Height is how long in days since last review. Horizontal lines denote session and single day. Vertical red lines are ‘states of memory’. Given how badly I have done on this one card, should I still keep trying to learn a foreign language?
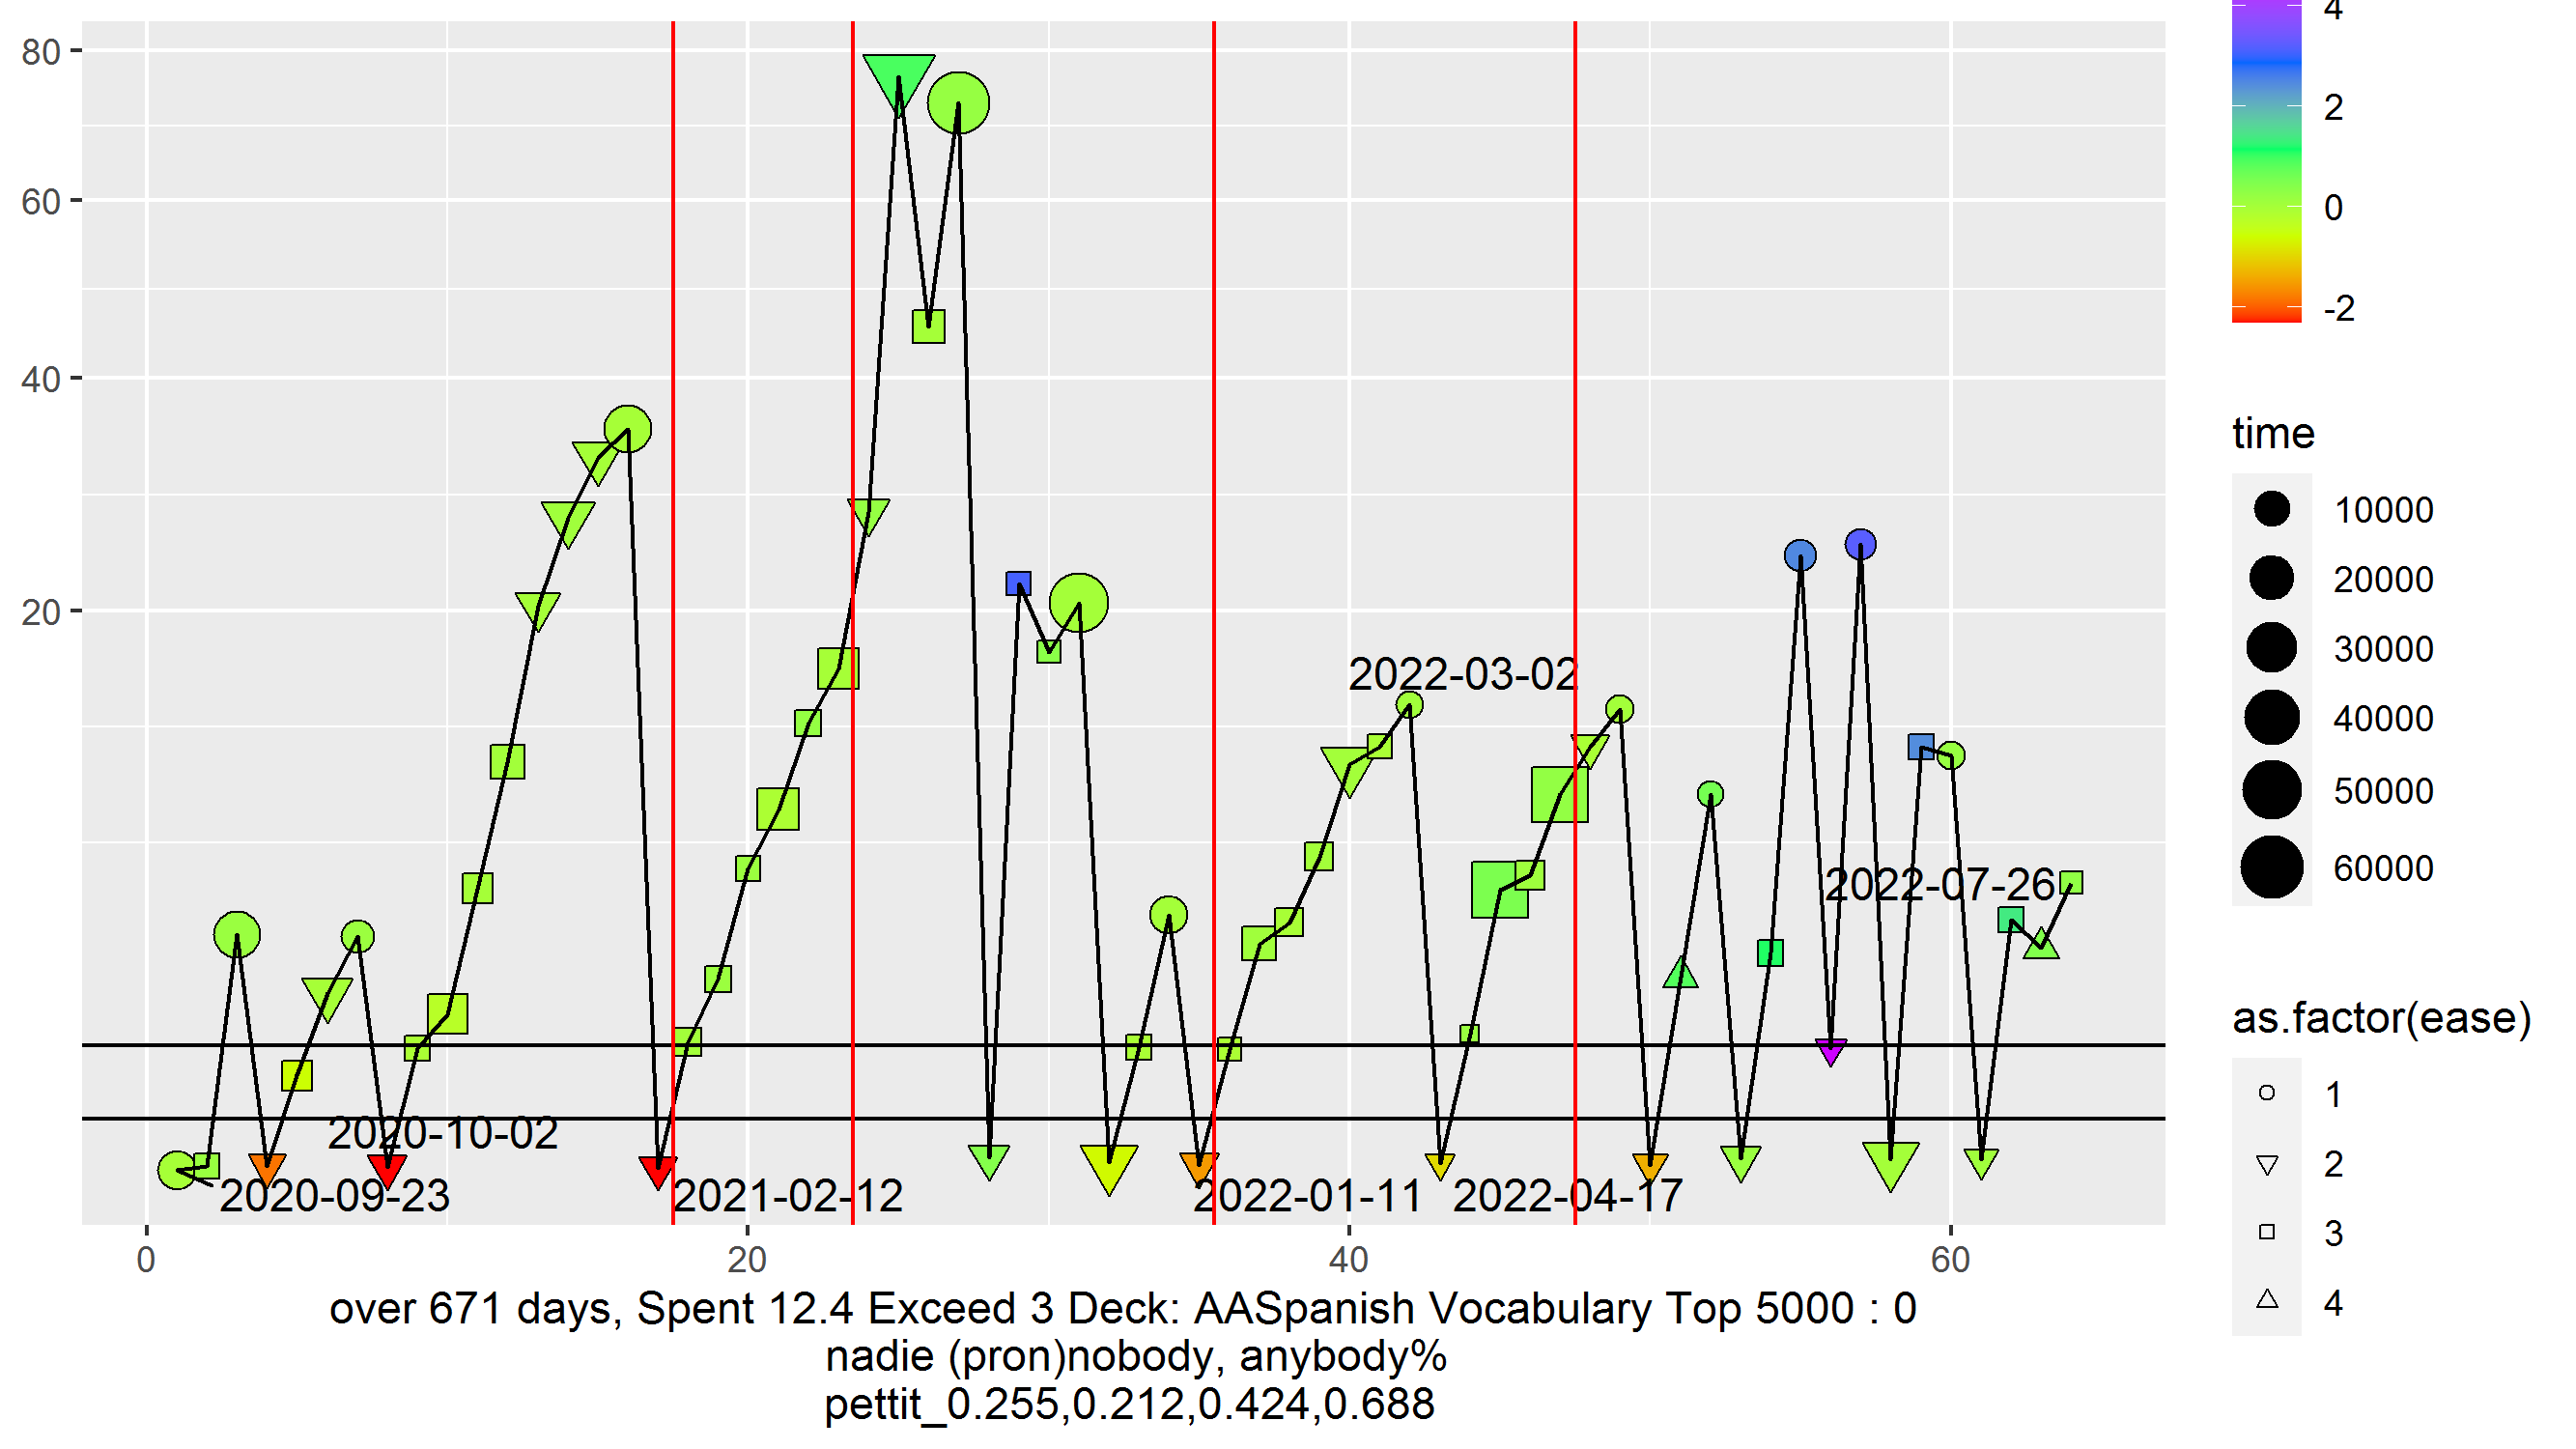
This is awesome! I wouldn’t say doing bad on a card, or a bunch of cards should influence whether you learn a foreign language, but perhaps performance on specific cards can tell you how well those cards are suited to helping you learn.
I personally made a field in all of my cards for mnemonics, where I put little jokes, stories, or pictures to help me remember specific elements of the cards I am trying to learn. I typically on use them for difficult cards or topics, and they seem to be helping some.
That does seem very useful. Next step of the project will be about text mining and should include some measure of effort or ease of each card. Could you give a few examples so that I can figure out how to detect a field for mnemonics?
Though people upvote this project no one uses it. I plan to mothball it until someone else gives me their data or runs the script on their own data and shows me the output. Please give me your collection.anki2 file!

Above is a scatterplot made using only the cards of a foreign language deck. Average number of repetitions per card is on y axis and the date is on x axis. Points are colored by number of cards reviewed in that session.
Plot shows lots of expected patterns. In the early sessions I was just learning cards and not reviewing many so there were many repetitions. (lots of red dots at top left) Sessions with more cards reviewed in them tend to spread less along the y axis (average repetitions per card). In the plot this shows up as blue dots being closer together than green dots. There were some good (around 4-2021, 7-2022) periods and awful sessions and periods of lax discipline.
Unexpectedly, there is a strong change point in the generative process where the first blue dot appears and sessions with high repetition and few cards stop. This is because before that point I did two sessions per day with only cards still being learned (rather than reviewed) in second session. Red dots at bottom suggest that I probably occasionally review small number of cards and then stop when the going gets tough. Therefore scheduling and my personal determination changes the distribution of the difficulty of cards reviewed in a session. Just using the average repetitions per session without adjusting for difficulty of cards is only vaguely related to performance and current cognitive ability.
Some of the theory and possible outcomes of the finished analysis:
https://wiki.openhumans.org/wiki/Flash_Cards_as_Cognitive_Test