Loading more information into the TR chart serves no purpose. And I don’t think Answer Buttons would be made better by turning it from its own graph to a pop-up sub-chart. These should stay as a separate graph and chart.
I hope other people like @sorata, @rossgb, @Anon_0000, etc. will see it too. I wouldn’t be making this topic if there wasn’t a reason for it. Users do get confused regarding where to look.
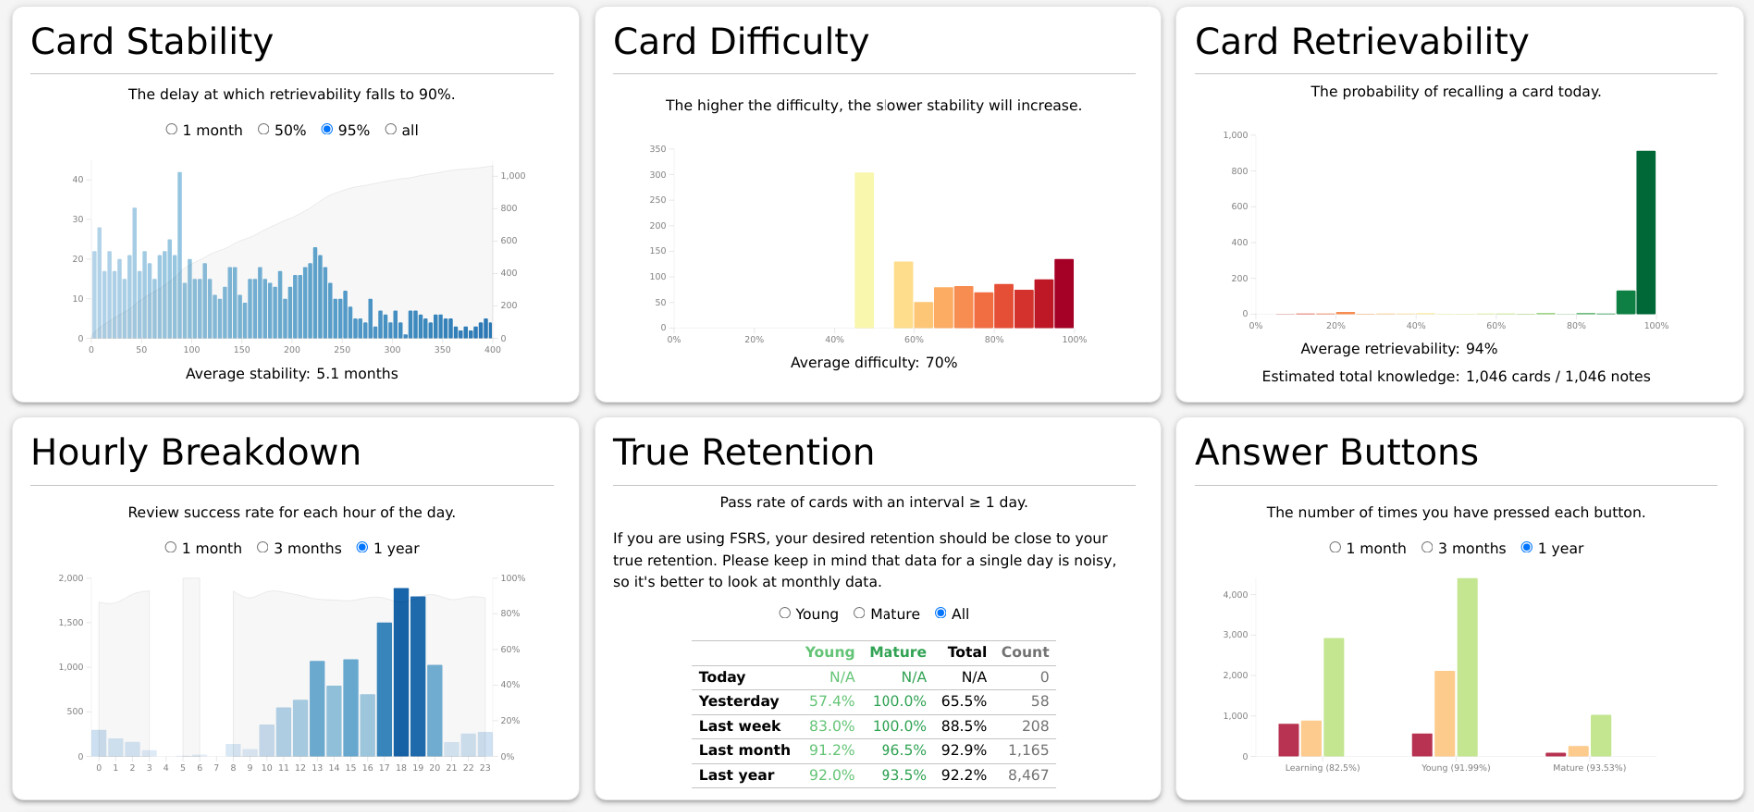
Maybe we could add a little description? I copyied the following from Statistics - Anki Manual and inserted it into the subtitle part. This wouldn’t solve redundancy between the two graphs, but could make it more obvious which graph is the right graph to check retention (provided the user reads the paragraph):
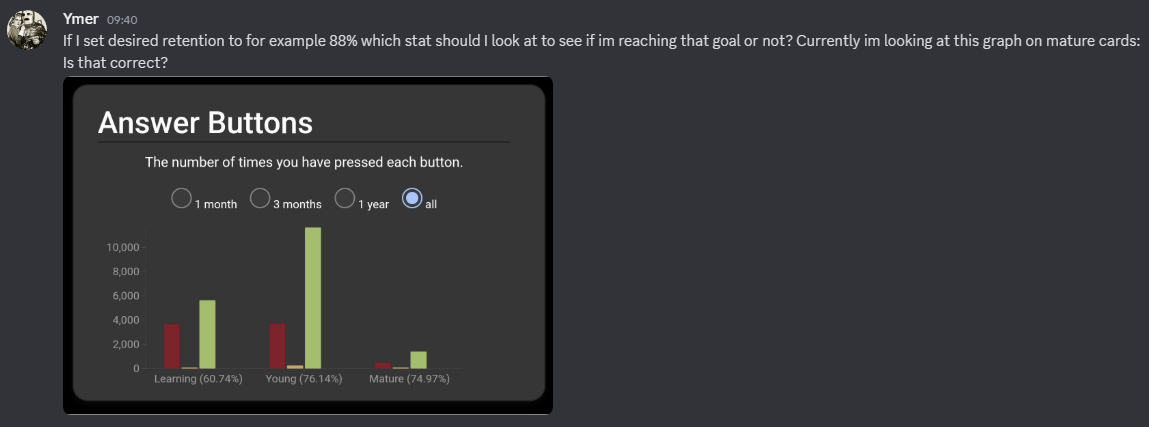
Maybe I’m missing the part where the user was confused between whether to look at Answer Buttons or True Retention? What I see is someone checking if they can look at the Answer Buttons graph for retention results – which they still can. Just because the True Retention chart exists, and calculates retention differently, doesn’t make Answer Buttons an incorrect answer, so I don’t see the problem here.
You didn’t provide any context or source for your screenshot, so I guess we’ll never know.
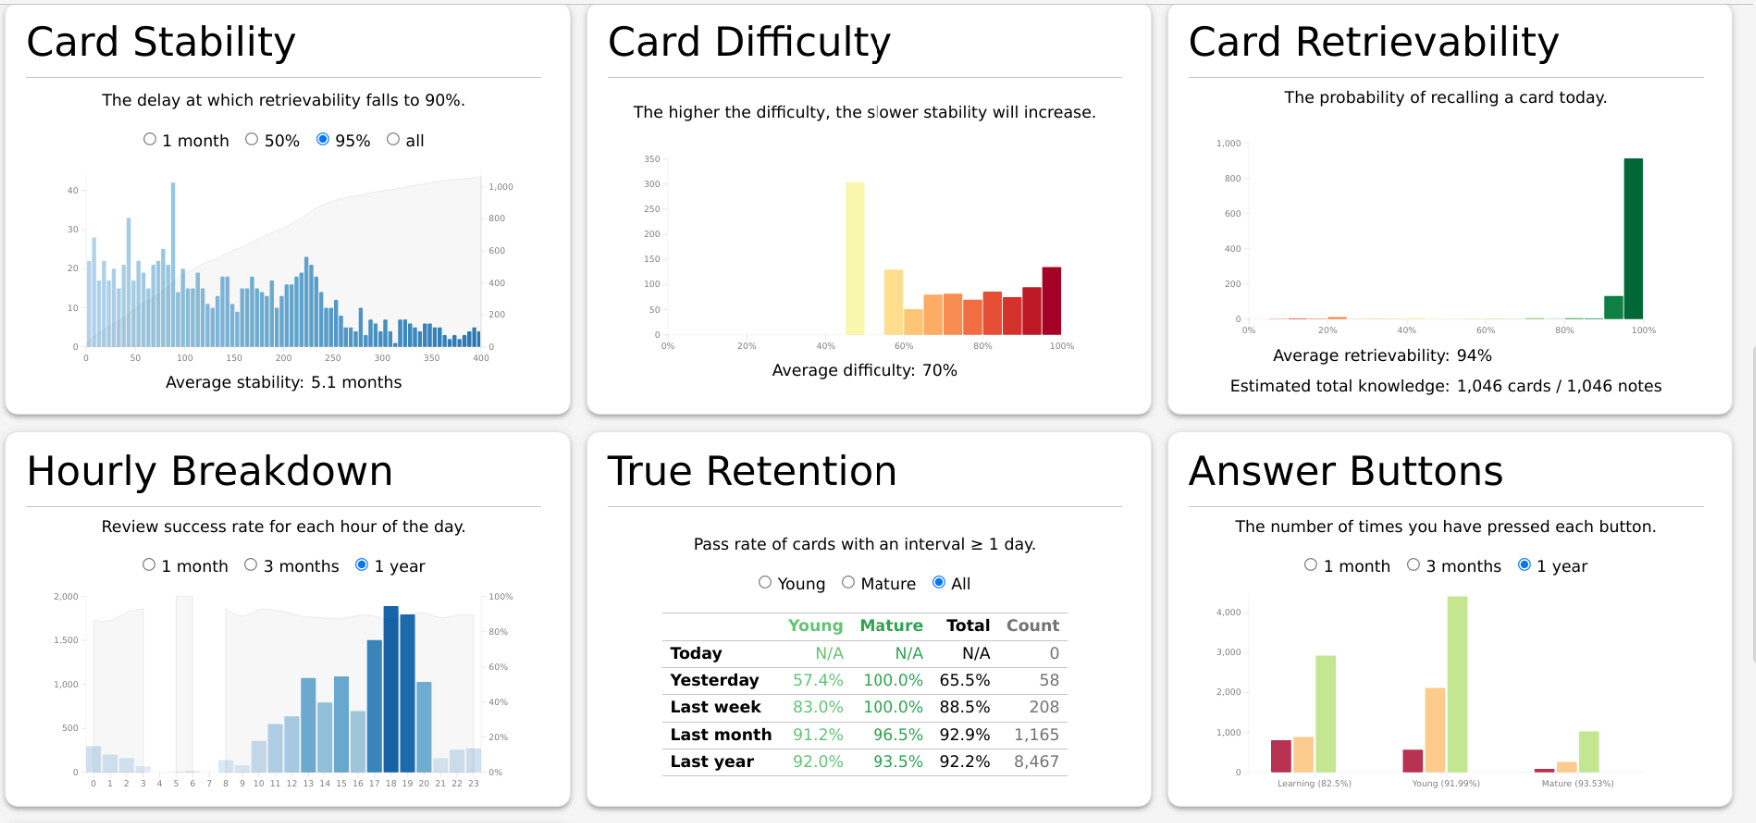
That’s not what it looks like on my PC (Anki 25.02, 038d85b1). Graphs don’t form rows, and there is “Added” after “Answer Buttons” but before “True Retention”.
Just a thought – if you consider Hourly Breakdown, True Retention, and Answer Buttons to be a set of “success or failure” charts/graphs – wouldn’t it make sense for TR to come first, as the overall chart? Then it could be followed by HB and AB (in either order) as the drill-down, nitty gritty graphs.
[I don’t know if anyone cares about Added, but it’s always been fine at the end, so I say leave it at the end, after those 3.]
I made a survey: https://forms.gle/dwkaJEsNTrvJF7q77
I will post it on r/Anki and on Discord tomorrow, for now I’m posting it here just to gather feedback and make sure I’m asking the right questions
EDIT: to anyone reading this and clicking the link - I will delete responses before “properly” posting it, so don’t bother responding right now now
When you want to find out your retention, where do you look?
Maybe you could make this easier by using something else than “retention” like “When you want to find out how much you remember, where do you look?”. This should reduce
bias towards the radio button with the word retention in it.
increase likelyhood of people understanding the question.
#2
Have you ever been confused about what you should look at when checking your retention - the “True Retention” table or the “Answer Buttons” chart?
Same here. I’d replace the “checking your retention” part with something like I mentioned above.
#3
Do you think “Answer Buttons” and “True Retention” should be combined into a single table/chart?
Or maybe “Answer Buttons” should be removed?
Not sure how useful the data of this question is going to be. But it probably doesn’t hurt to ask it anyways. The question is biased though, which is a problem according to the false memory paradigm.
It wouldn’t be biased if it was something like this:
remove Answer Buttons
remove True Retention
remove both
combine both
keep both as is
#4
Do you think adding this text is a good change?
Good to ask, but there’s a problem. Adding this text → what text exactly? If you had a “before → after” picture it would make things more obvious – and very likely increase the quality of the data from that question.
Good to ask, but there’s a problem. Adding this text → what text exactly? If you had a “before → after” picture it would make things more obvious – and very likely increase the quality of the data from that question.
Please provide two images then. As for other points, I’ll try changing the wording. I don’t see the problem with question 3, but I changed it slightly anyway.